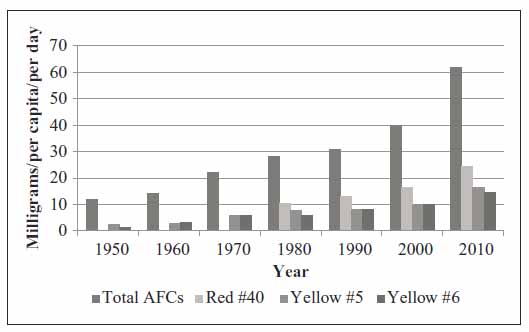
Figure 1. Trends in the amount of artificial food colors manufactured for the US market since 1950 as certified by the FDA for 3 common food colors and the total of all colors. Click to see larger.
Clinical Pediatrics, 2014. Feb; 53(2): 133-40.
The amount of food dyes certified over the years has increased more than 5-fold since 1950 (12 mg/capita/day) to 2012 (68 mg/capita/day). Studies that used 50 mg or more of food dyes showed a more negative effect on more children than those which used less.
The study reported here is the first to quantify the amounts of food dyes in foods (specifically in beverages) commonly consumed by children in the United States.
In response to industry criticisms that their values were too high, Stevens remeasured
the artificial food color concentrations reported using a method approved by Harp et al (2013) and correcting for any overlap and interference from other colored ingredients. The results were published as Stevens (2015): Amounts of Artificial Food Colors in Commonly Consumed Beverages and Potential Behavioral Implications for Consumption in Children: Revisited. (See link below). The numbers below are listed for each study.
Winners with some of the highest amounts of food dye per single 8-oz (240 ml) serving of beverage were:
- Faygo Redpop — 34 mg (2014), 30 mg (revisited 2015)
- Kool-Aid Burst Cherry — 52.3 mg (2014), 50 mg (revisited 2015)
- Powerade Orange — 22.1 mg (2014), 18 mg (revisited 2015)
- Full Throttle Red Berry — 18.8 mg (2014), 15.0 mg (revisited 2015)